Daily Pulse · · macro · EWT
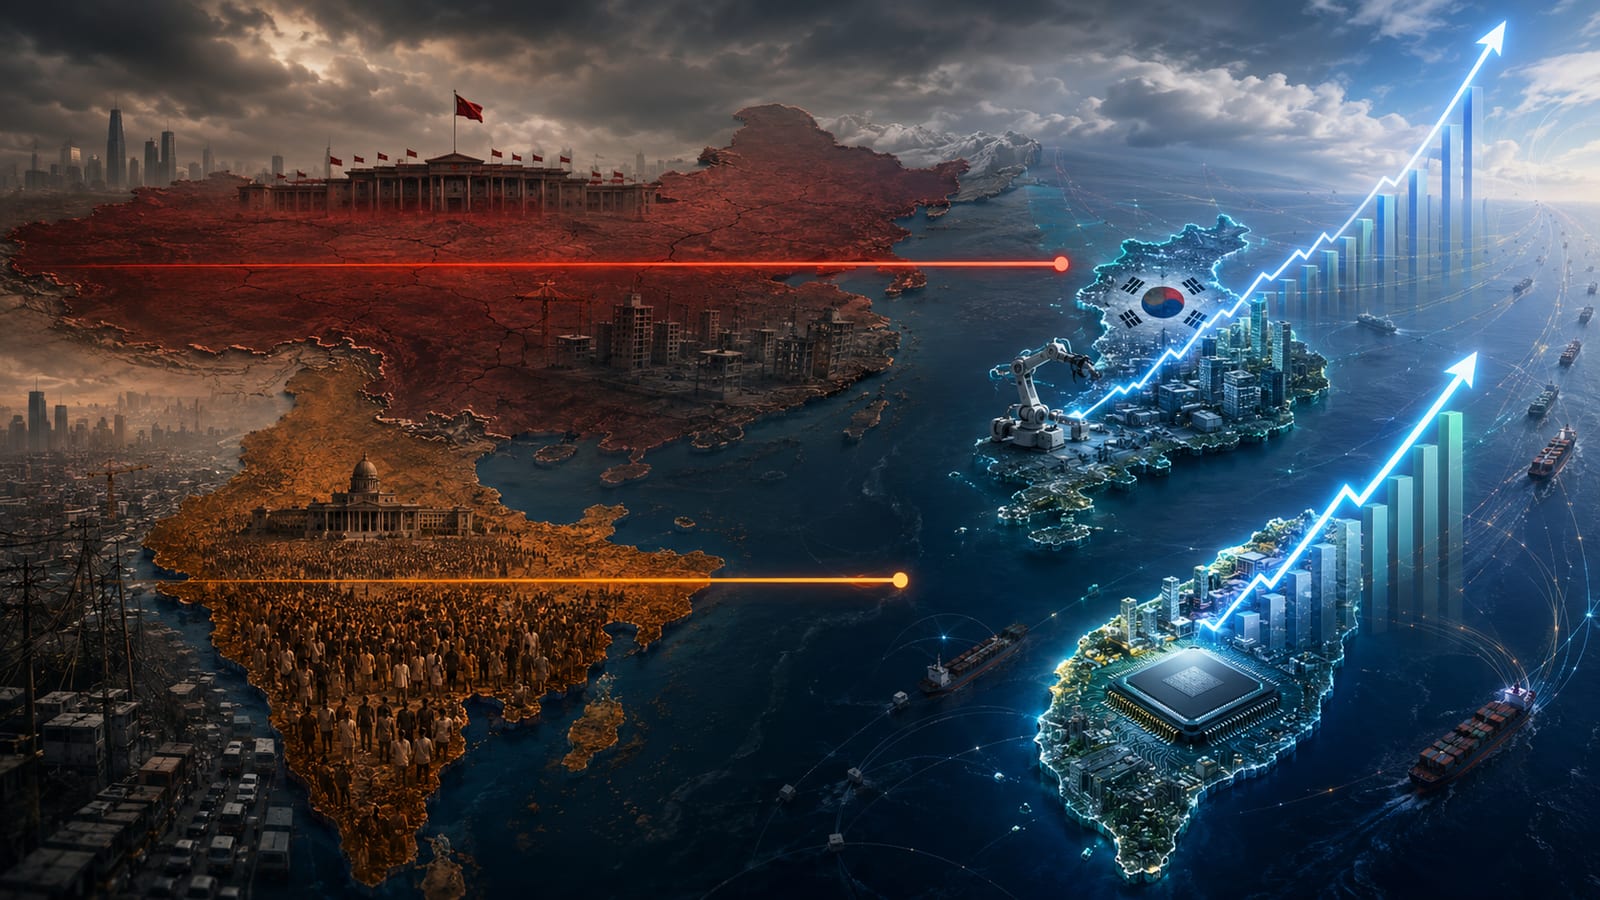
Put four monthly charts next to each other and you get one of the cleanest splits in global equities right now. The two largest economies in Asia are going nowhere. The two chip exporters are going vertical. GDP says one thing; the tape says the opposite — and the tape is the one with your money in it.
| Market | Level | Day | The read |
|---|---|---|---|
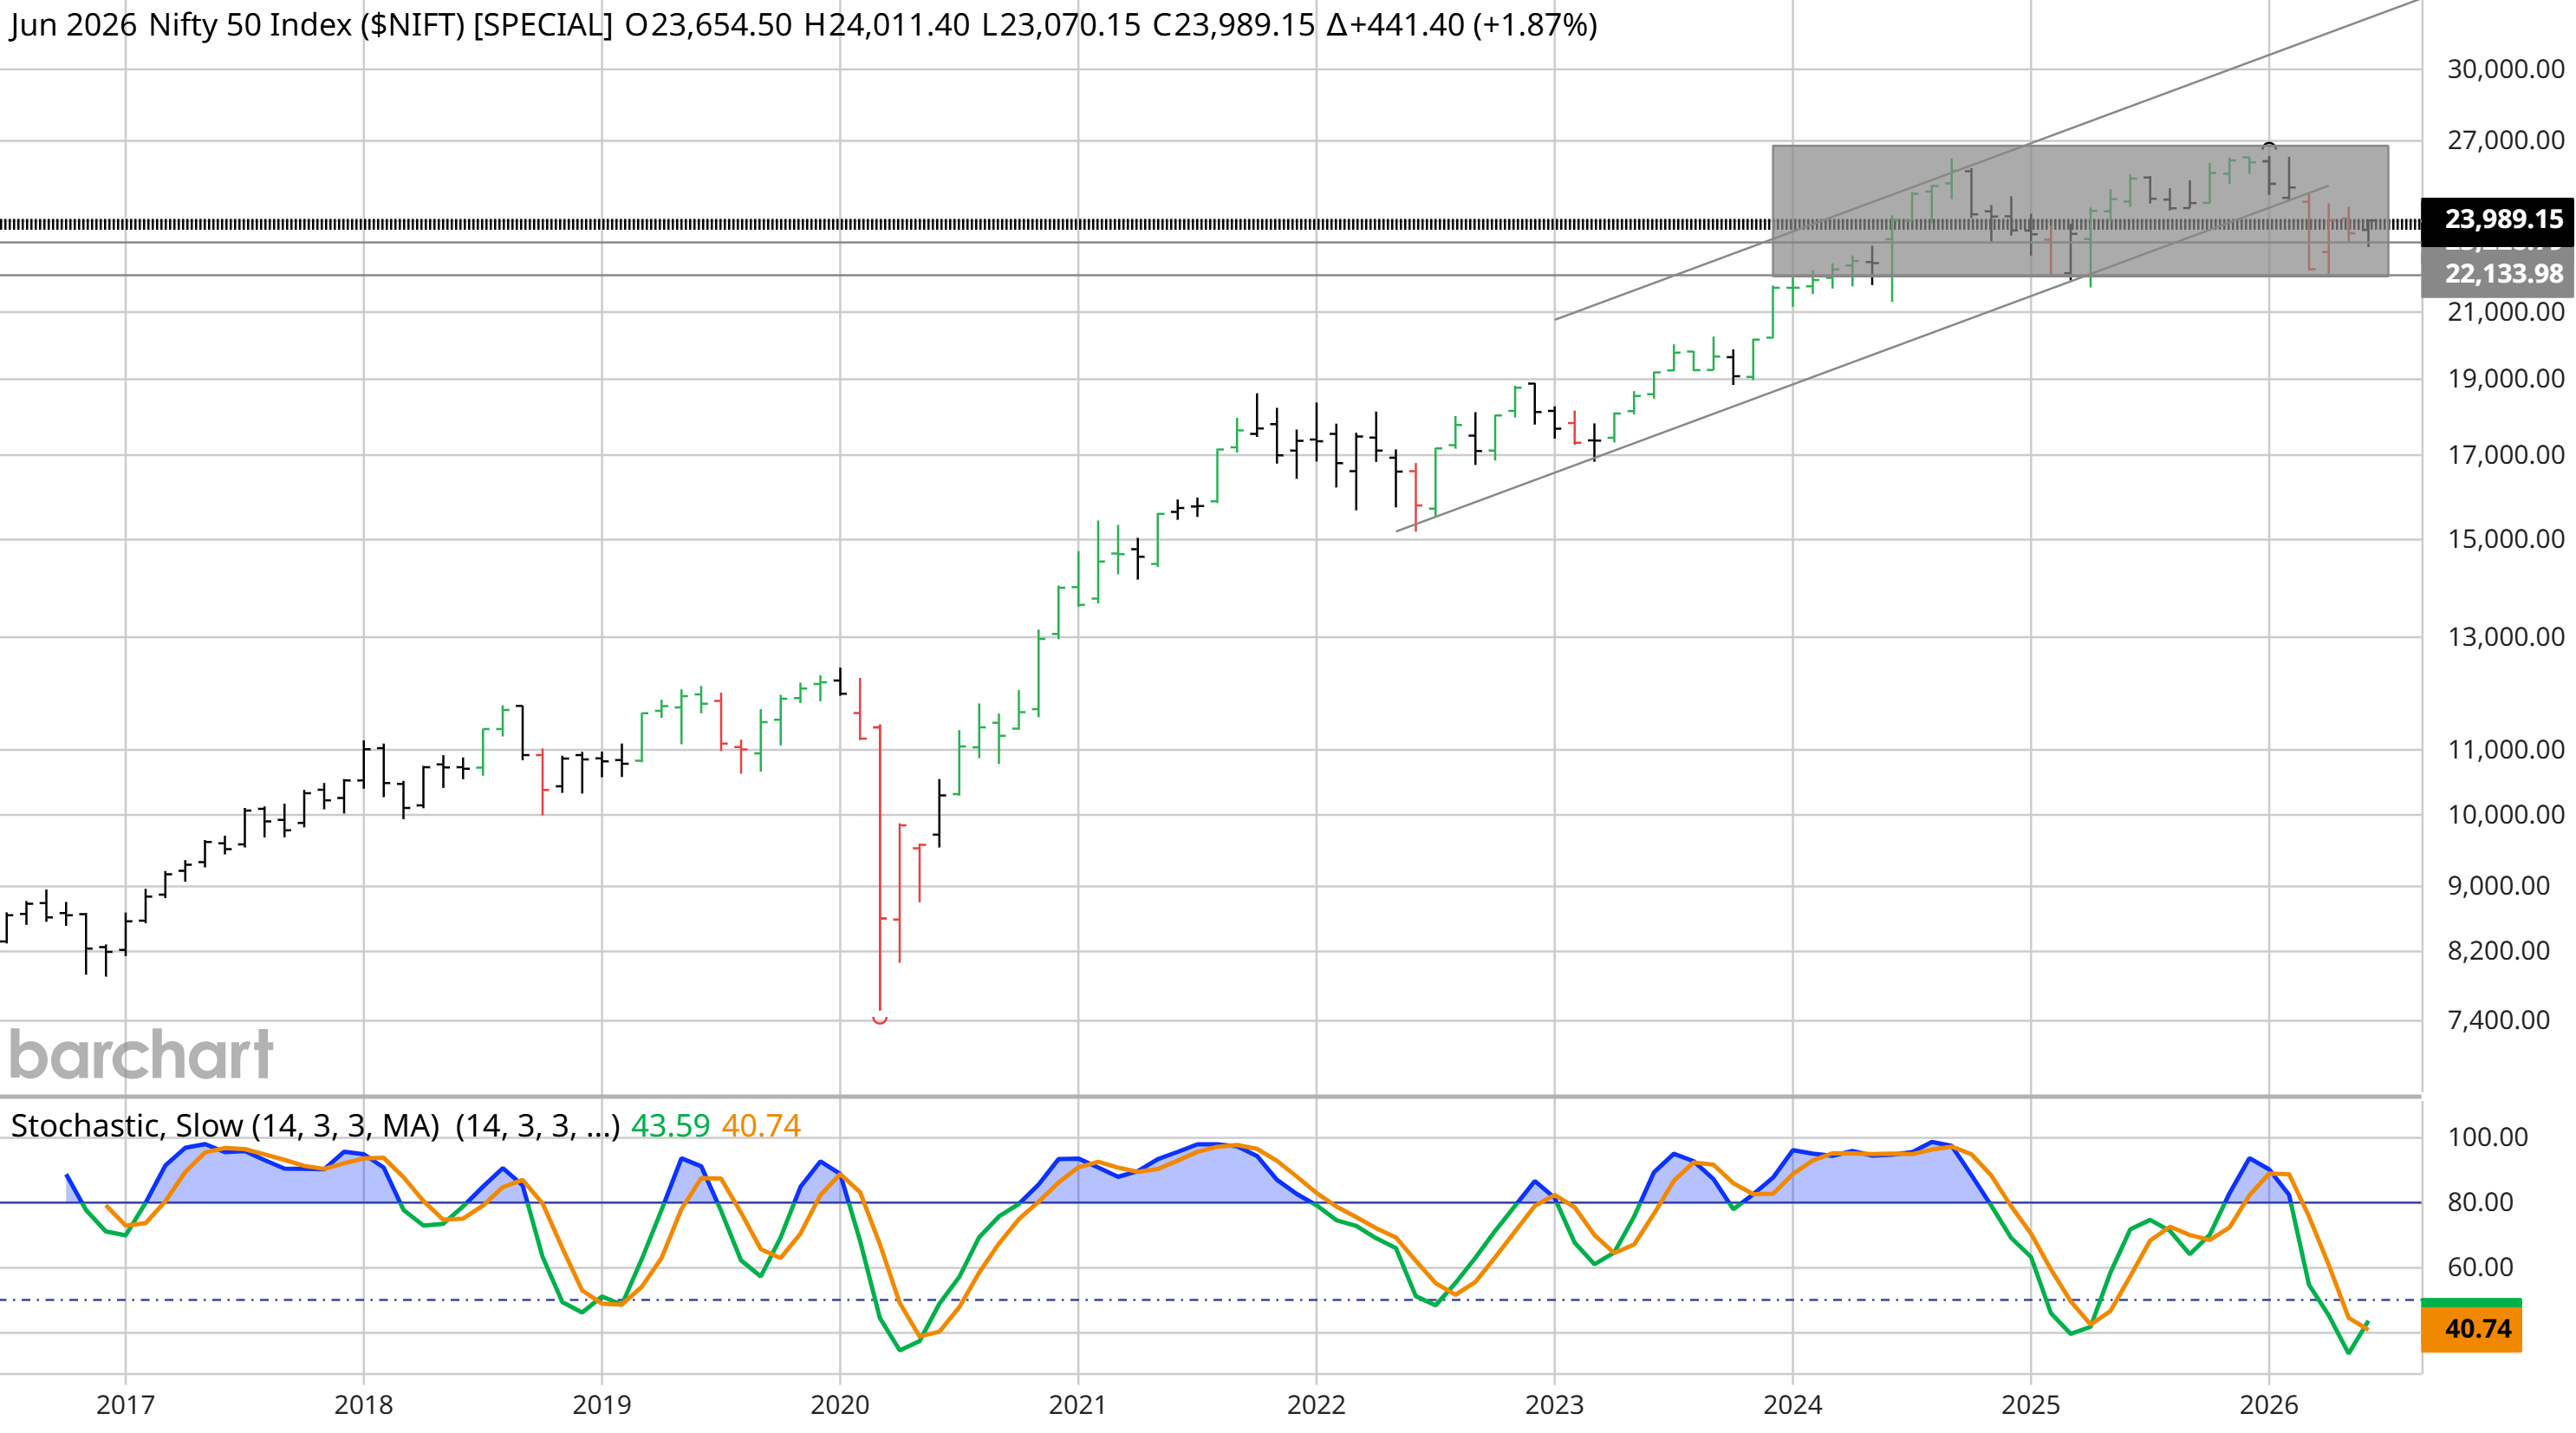
| India — Nifty 50 | 23,989 | +1.87% | Range-bound 18 months |
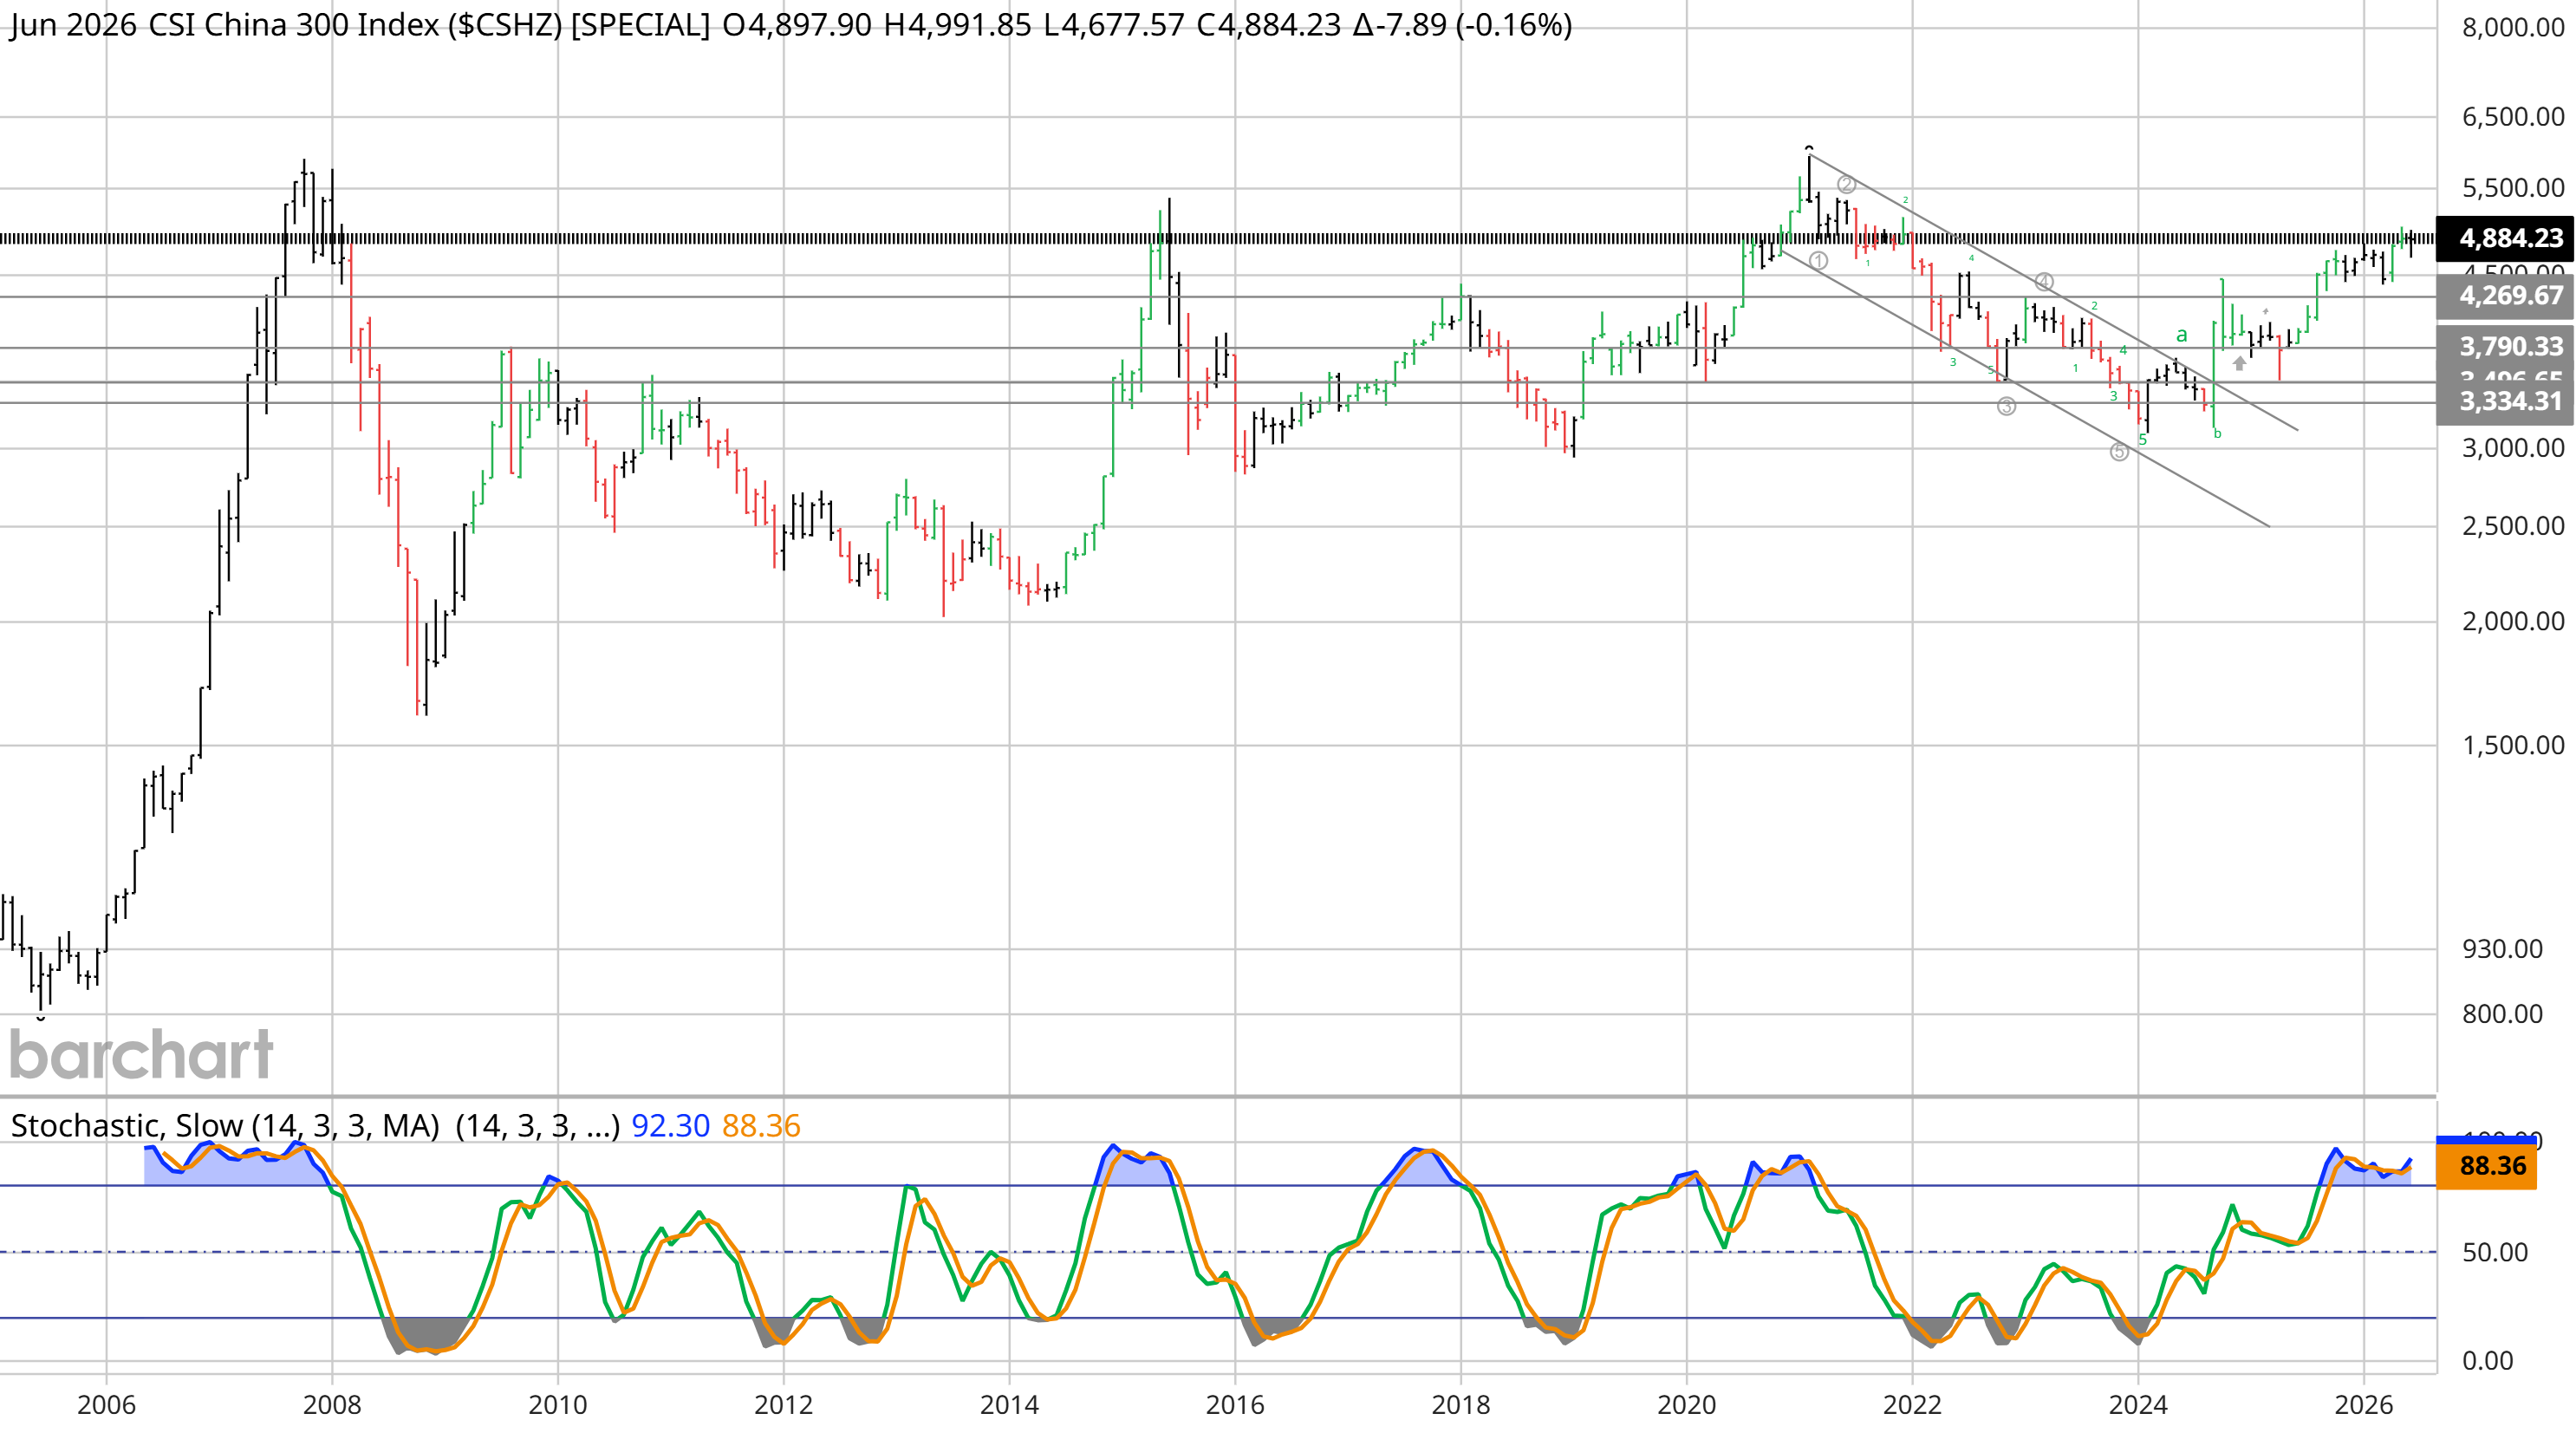
| China — CSI 300 | 4,884 | −0.16% | Structural sideways decade |
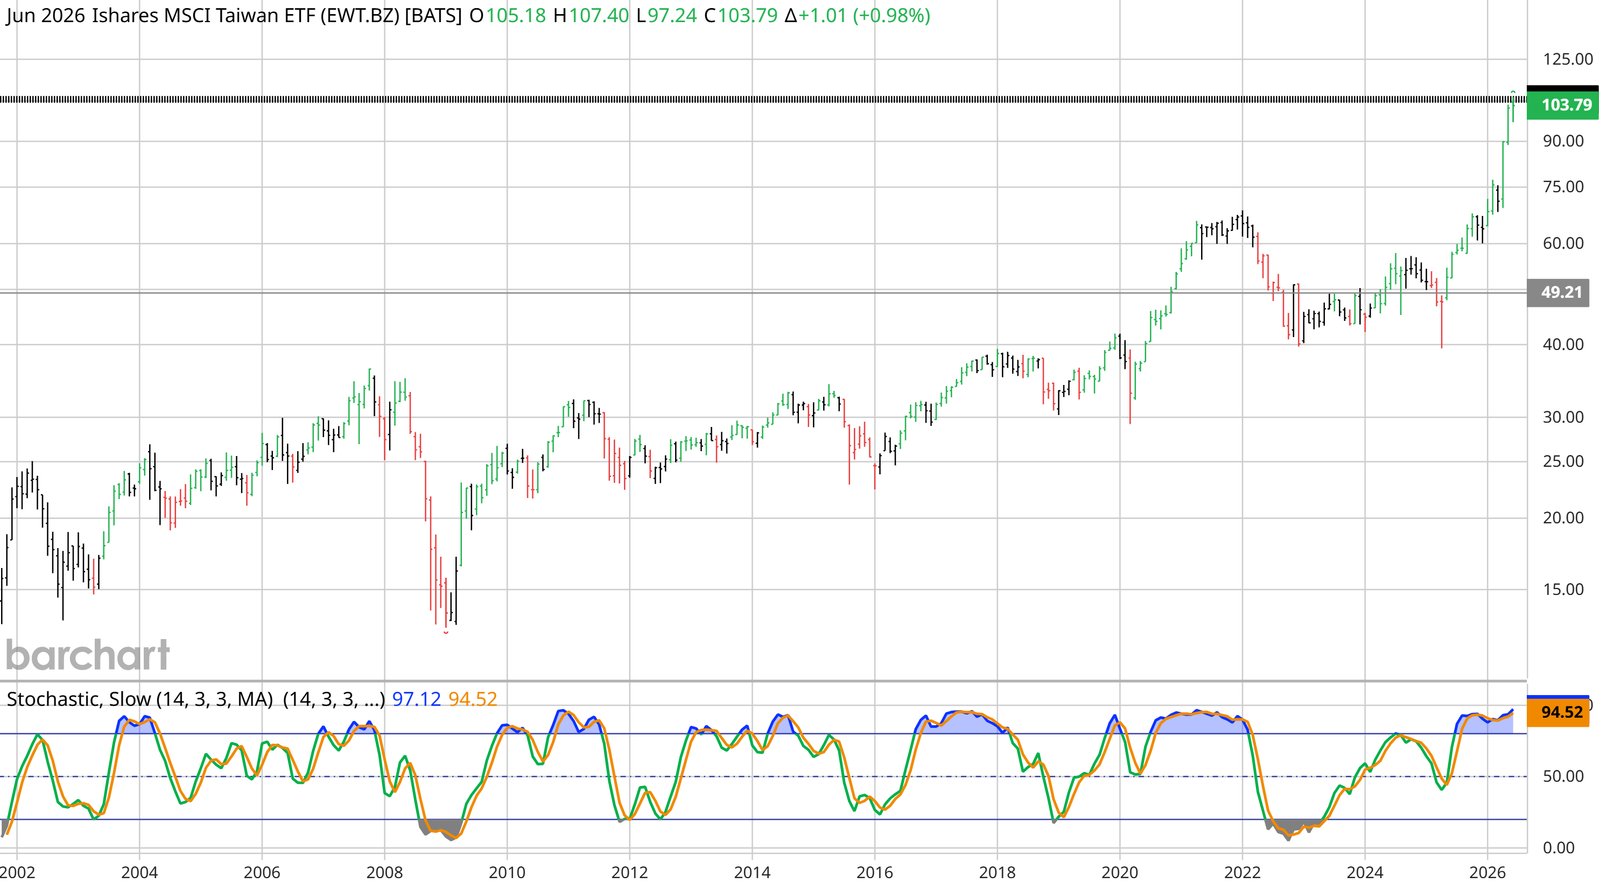
| Taiwan — EWT | 103.79 | +0.98% | All-time high, parabolic |
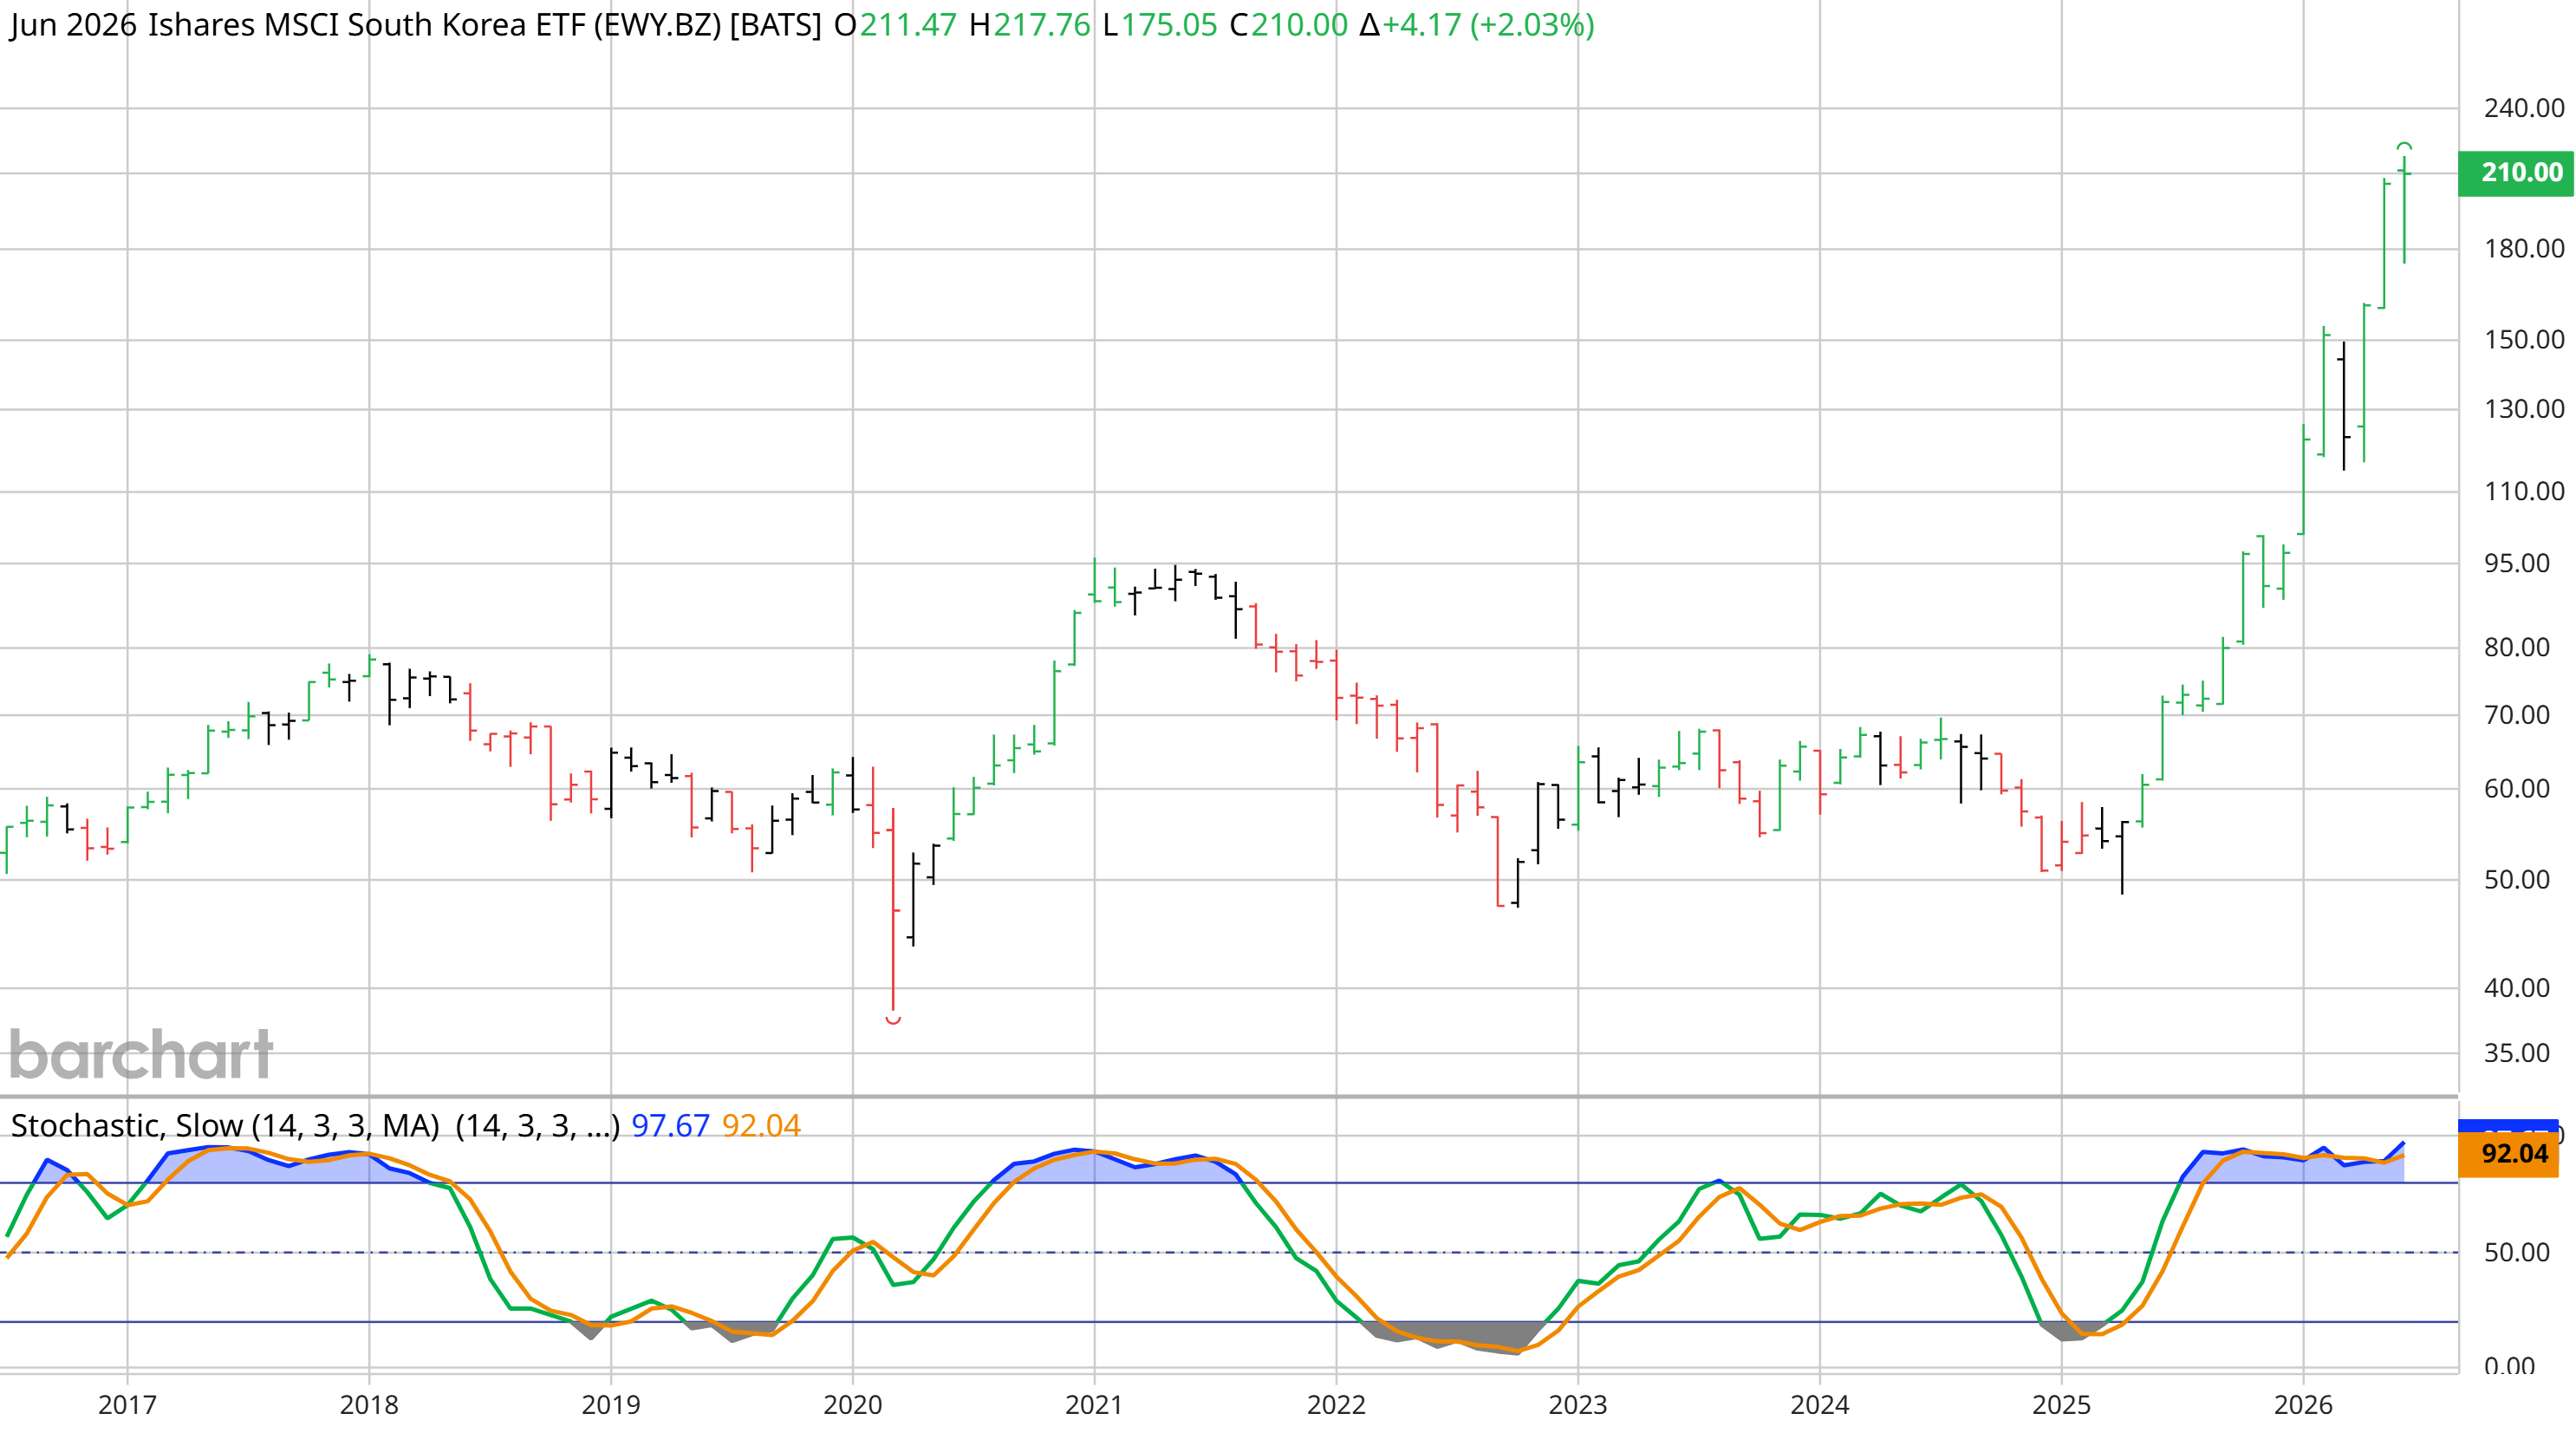
| S. Korea — EWY | 210.00 | +2.03% | Vertical off a multi-year base |
India — Nifty 50: a market resting, not leading
A spectacular bull run from ~8,000 in 2017, then nothing. For roughly the last 18 months the index has churned inside a box, about 22,100 to 27,000. The slow stochastic at 40.74 is rolling over — a market resting, not leading.
China — CSI 300: a sideways decade-plus
Here the word is structural. Thirteen years into the Xi era the index still sits below both its 2007 peak (5,877) and its 2021 peak (~5,900). The economy has quadrupled; the index has built no durable trend. The recent bounce has stochastics stretched to 88 — but China has failed at exactly these levels before.
Taiwan — EWT: an all-time high
iShares MSCI Taiwan at 103.79, a near-parabolic break above a decade of range. The tigers are running.
South Korea — EWY: vertical off the base
iShares MSCI South Korea at 210.00, vertical off a multi-year base that capped near 95 for years. Monthly stochastic at 92.
So the giants sleep and the tigers run. Five reasons why.
1. Composition is destiny
IT and semiconductors are roughly 80% of Taiwan's market and over half of Korea's — versus under 10% in India and China, which are dominated by financials, materials and consumer names. In a year when the market wants exactly one thing — AI hardware — index composition decides everything. Korea and Taiwan are the AI supply chain. India and China are not. It is the same lens our sector-dispersion tool turns on a single index: is the move broad, or carried by a few names?
2. The toll booths of the AI build-out
Taiwan is essentially one stock: TSMC, ~42% of the benchmark, up ~49% year-to-date, guiding to a ~25% revenue CAGR through 2029. It is the chokepoint every chip designer — Nvidia, Google, AMD — has to pass through, the only one that wins regardless of who wins. Korea is the memory leg: SK Hynix and Samsung riding the HBM supercycle, with the KOSPI roughly doubling in 2026 and Goldman Sachs naming Korea its highest-conviction market in the region on an exceptional earnings expansion. This is the picks-and-shovels trade in its purest form — and earnings, not sentiment, are driving it. It is the same whole-chain build-out our Rubin Build-Out 100 tracks from the other side of the Pacific.
3. Regulators are pouring on fuel
Taiwan lifted the single-stock cap for domestic funds from 10% to 25% — and only TSMC qualifies — pointing to billions in near-mechanical buying. Korea's Value-Up program is finally closing the old “Korea discount,” and a potential MSCI developed-market upgrade could pull tens of billions more into the market. These are structural inflows, not mood swings.
4. The money has to come from somewhere — and it's leaving India
Foreign investors have pulled north of US$20bn out of Indian equities in 2026, on pace for the worst outflow year since the market opened to overseas capital in 1993. A large share went straight into Taiwan and Korea. In late May, Taiwan's market cap overtook India's to become the world's fifth-largest — a sub-US$1tn economy leapfrogging a ~US$4tn one, because markets price earnings, not GDP. India is also holding the wrong macro hand this year: oil-importer exposure into an Iran-driven crude spike, a soft rupee, ~21× earnings, and negative earnings revisions just as everyone else is being upgraded.
5. China's drag is its own
China isn't waiting on flows — it is fighting deflation, a grinding property downturn, real rates that are still too high, and weak credit creation. Export controls cap whatever AI upside its national champions might otherwise have captured. Until policy turns genuinely bold, the decade-long range stays the base case.
The part that matters most: no turn is in sight
Nothing on these charts says the leadership is about to flip. Korea and Taiwan are earnings-led, with TSMC's ~25% CAGR running to 2029 and a memory cycle measured in years, not quarters. The catalysts — MSCI reviews, regulatory inflows — sit ahead, not behind. India needs earnings upgrades and a flow reversal it does not yet have. China needs a policy bazooka it has not fired.
Price is the only truth. Right now it is telling you the AI build-out — not the big economies, the supply chain underneath them — is where Asia lives.